You can look at the rating pool Stats Global Leaderboards on the website.
Looks like this for blitz:
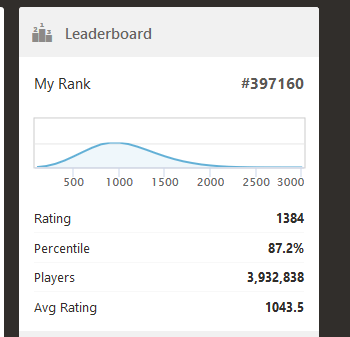
You can move your cursor over the graph to see how many players are in each band.

You can look at the rating pool Stats Global Leaderboards on the website.
Looks like this for blitz:
You can move your cursor over the graph to see how many players are in each band.

Thanks Martin.
Do you have a link to that?
Also to the same for the Rapid and Daily?
I am new to the site so still finding my way around.
You can get there by going to your Stat page (Home > Stats) and clicking the word Global under the Leaderboard panel.
For blitz it goes to https://www.chess.com/leaderboard/live and you can use the drop-down at the top to change the rating pool you are interested in.
Thanks Martin.
All good.

The distribution is roughly a bell curve. The page that Martin pointed out gives you your specific rating, your percentile, and the mean value for all players. Using this information you can find percentiles for any arbitrary score. Go to an online calculator, like http://onlinestatbook.com/2/calculators/normal_dist.html, enter the mean, then enter your rating in the "below" box. Change the standard deviation until the output matches your known percentile. Then, with the standard deviation known, change the rating however you like to see the associated percentile.

The distribution doesn't even almost match a normal distribution. It's highly skewed with a very heavy right tail. It's also probably truncated at zero from the looks of things

The distribution is roughly a bell curve. The page that Martin pointed out gives you your specific rating, your percentile, and the mean value for all players. Using this information you can find percentiles for any arbitrary score. Go to an online calculator, like http://onlinestatbook.com/2/calculators/normal_dist.html, enter the mean, then enter your rating in the "below" box. Change the standard deviation until the output matches your known percentile. Then, with the standard deviation known, change the rating however you like to see the associated percentile.
I wouldn't rely on using standard deviation on distributions that aren't symmetrical. You can clearly see in the graph that chesscom's rating distributions are skewed to the right.
You used to be able to see the distribution country by country. If you bothered to look at it with a sceptical eye you would notice that it resembled Garrison Keilor's Lake Wobegone "Where all the women are good looking and all the children are smarter than average"
There were only 4 countries that had an average rating below the global average and they were all tiny. The Falkland Islands FFS.
Pity that's disappeared

I"m 1500 and I just had a game where my accuracy was 54% with 4missed wins and still won the game. I'm starting to think low-rated players are smarter.
I guess it depends how focused you and your opponent are.
In this case we were both dummies

The distribution is roughly a bell curve. The page that Martin pointed out gives you your specific rating, your percentile, and the mean value for all players. Using this information you can find percentiles for any arbitrary score. Go to an online calculator, like http://onlinestatbook.com/2/calculators/normal_dist.html, enter the mean, then enter your rating in the "below" box. Change the standard deviation until the output matches your known percentile. Then, with the standard deviation known, change the rating however you like to see the associated percentile.
Based on this, the daily rating standard deviation is about 155. Thanks. Cool page. (when used make sure to remove the comma at the end of the link)

The distribution in NOT a normal distribution. It is closest to a Poison distribution. Using the mean of the poison you can calculate your percentile. It’s a bit tricky but it can be done. The Normal distribution goes from negative to positive infinity. The poison starts at zero and goes to positive infinity. To me, and maybe just me, the Poison describes what happens to a normal distribution when you peg the left side to a lower bound (Zero?). I'm sure pure math and stat people would be horrified at this interpretation, but I am an engineer, and the idea "works" for me. But to be clear, the chess.com rating distribution is closer to a Poison than a Normal. The first thing one should do with data is graph it, and then scrub it if necessary, and then choose a model. Knowing how the data came to be is also a factor in choosing the right model. In this case we know the lower bound of a chess rating is some fixed positive number (Someone mentioned 100) and we also know that the ratings are generated by a semi-random repetitive "process" (game outcomes), which is just the type of stuff the Poison is good for. When graphed, the puzzle rating distribution looks close to a Poison too, but it is bumpy. It would be interesting to dig deeper to find out why. But I don't have any more info than the graph to go on. In either case the reality of the data is quite likely to stray from the "ideal" (model). Interesting too is that I have seen a graph of USCF ratings that has two "bumps", my presumption is that USCF ratings include two distinctly different populations, serious tournament playing adults, and a mix of scholastics. My degrees were awarded in 1985, 1987, and 1996 and I live in Lake Woebegone.
The distribution in NOT a normal distribution. It is closest to a Poison distribution. Using the mean of the poison you can calculate your percentile. It’s a bit tricky but it can be done.
I can't see any reason why the distribution of Elo would be modelled well by a Poisson distribution.
edit: I was much too vague in this statement. There is absolutely no way an Elo distribution is well-approximated by a Poisson. Poisson models events within a fixed time or similar. This is in no way similar to what Elo measures: a rough measure of skill.
The distribution doesn't even almost match a normal distribution. It's highly skewed with a very heavy right tail. It's also probably truncated at zero from the looks of things
The minimum rating of 100, not zero. That has a tendency to push the left hand tail to the right with people piled up near 100 (instead of zero or negative ratings) and the people that can beat them being a bit above 100, etcetera.

I'm curious what my percentile is compared to people who have played about the same number of games as I have.

You can look at the rating pool Stats Global Leaderboards on the website.
Looks like this for blitz:
You can move your cursor over the graph to see how many players are in each band.
I thought the elo rating distribution would always go lower, did not know there was a bump in the curve
How can i find out in which percentile am i for the amout of time i played
How can i find out in which percentile am i for the amout of time i played
That's available on the website stats for pools where you have at least 20 games in a particular pool in the past 90 days. https://support.chess.com/article/857-what-does-percentile-mean

How can i find out in which percentile am i for the amout of time i played
How did you even find this forum?
How can i find out in which percentile am i for the amout of time i played
How did you even find this forum?
He was asking for the comparison relative to the amount of time he's played the game, i.e. comparing against people who have played for 20 hours rather than the whole population.
In live chess I recently climbed from around 800 to the dizzy heights of around 1000
On my stats page I was told at 800 that I was around 25% percentile
When I got to 1000 I was told I was 33% percentile
So I can get some limited information about the distribution of the players' ratings on chess.com by looking at my own or another members profile
But is the full set of stats available so I can find out what the median is and then query arbitrary score levels to find out what percentile they are. And maybe see the actual distribution graph of all the members on chess.com ?